

Meta-e.d.u.
the challenge:
Educators have increasingly more challenging jobs as the landscape of education changes; the field is becoming increasingly complex as the larger society in which the education system is situated becomes more complex. One primary complaint that teachers often have is not having enough time to accomplish all of the complex tasks for which they are responsible. How can we respond to the increasingly challenging education system in support of teachers while not losing sight of students as the priority and the challenging role of the administrator?
MY ROLE:
Contractor, UX Research and Data Management
Company sponsor:
Washington Teacher’s Union
abstract
I served as the primary point of contact for all research and data-management aspects of this project. Meta-analytics, user interviews, focus groups, and naturalistic observation revealed the multifaceted needs of different stakeholders. Preliminary findings also revealed a tension between the needs of different stakeholders. One major intersection of all stakeholders was the need to collect, visualize, and easily respond to real-time data. This would allow teachers to respond in real-time with interventions for lowest performing students and gain professional development as needed; administration to set-up institution-wide operational best practices that respond in real-time to lowest performing students and offer professional development as needed; and parent-student dyads would be able to access additional web-based resources that are also available on a mobile-responsive platform. Product prototype was essentially a data management tool that would have the feel of a digital teaching assistant, in implementation, it would be accompanied with an associated user flow design, which makes data collection and intervention a more efficient process. It was designed to respond to the needs aforementioned and integrate resources for each stakeholder that can facilitate a multitude of challenges related to learning challenges; behavior management; homework help/tutoring; and skills transference between classwork, tests, and state mandated standardized testing.
The Team
Other than my role, the team was comprised of a UI designer, a subject matter expert (education), a teacher consultant, and a product owner.

One of over 40 different analyses that I ran using SPSS (transferred into Excel for easier presentation-related manipulation), which reflect significance in the model for some constructs (a=.01; p=.000) as well as Cohen D-statistics which reflect the relative effect sizes.
methodologies: Design research phase
INDIVIDUAL INTERVIEWS: My team collaborated with the Washington Teacher’s Union to establish a set of user personas and mental models of target market. I conducted 18 individual interviews—-8 teachers, 4 administrators, 3 students, and 3 parents (2 mothers and 1 father). nter-rater reliability was used to validate findings.
FOCUS GROUPS: I conducted two rounds of focus groups. Round 1 was homogeneous groupings to capture the shared or collective sentiment of each institutional affiliate.
Round 2 was heterogeneous groupings to capture and attempt tp resolve tensions in perspectives on the challenge with the product design in the center of the process.
META ANALYSIS OF SECONDARY DATA: Meta-analysis of secondary data was conducted and findings were compared to qualitative assessments.
:
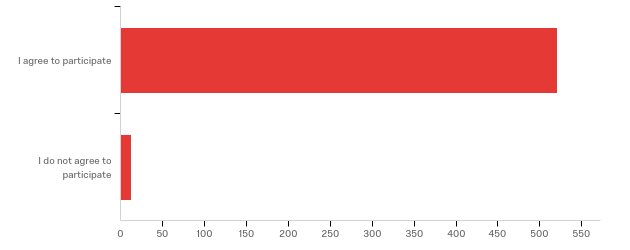
The second phase was the data collection phase in which we made use of my team’s and the client’s marketing channels to promote the survey. We used a census sampling approach in which all affiliates that were actively employed were contacted and invited to participate in the survey. In addition to census sampling we encouraged the client to assist with oversampling for small and underrepresented groups since this was a variable in which they were particularly interested.
We reached out goal of n=1,500 across all 3 affiliate groups. the data were successfully normative and representative.


PHASE 3:

The third phase involved data analysis and report writing in collaboration with the qualitative co-consultants. My approach was to report findings through a combination of descriptive and multivariate statistical techniques using composite variables that were pretested for validity (using metrics such as Chronbach-alpha, Eigen values, skree plots, and simple structure factor analysis).
Preliminary analyses provide confirmation of the psychometric properties of the composite variables included in the study, and provide guidance for data cleaning of random and malicious responding, as well as missing data. Reports were generated for the most statistically significant findings and presented to the client.

Analyses of variances were conducted on the entire sample, inclusive of all affiliates. ANOVA mean’s differences tests were conducted for select dependent variables to examine patterns in the data rather than to test hypotheses. These analyses should not be confused with parametric tests with expansive experiment-wise error rates.
Rather than examine significance tests, I examined effect sizes using Cohen’s d, incorporating only medium sized effects into our discussion of the meaningfulness of the mean differences between groups. This inductive approach to quantitative data analyses provides a wealth of information about the affiliates which is specific to their experience with our client. It also provides some assurance that the person behind the data-point is kept in mind, and that the findings are person-centered.

As a fundamental part of my process, I try to interact with the data rather than just analyze it. The difference, for me, is that one can look for numerical patterns and report findings (I do that too); but to take it a step further, I like to experience the information as if I am the survey participant. I engage the data in such a way that helps me understand the story they are trying to tell me in the numbers.
REPORTING and RECOMMENDATIONS
It is a common practice to make sure to report data in user-friendly language. Not everyone will have the same level of familiarity with data-science. I also make sure to always connect recommendations back to the original challenge and the institutional bottom-line relative to what they hoped to achieve from this consultation. As such, I usually include as much data visualization as possible. I also take this time to run further analyses if needed to fill in gaps in the “story” I’m attempting to tell within the numbers.


