
PERCEPTIONS of Institutional Program efficacy
and
affiliate attachment
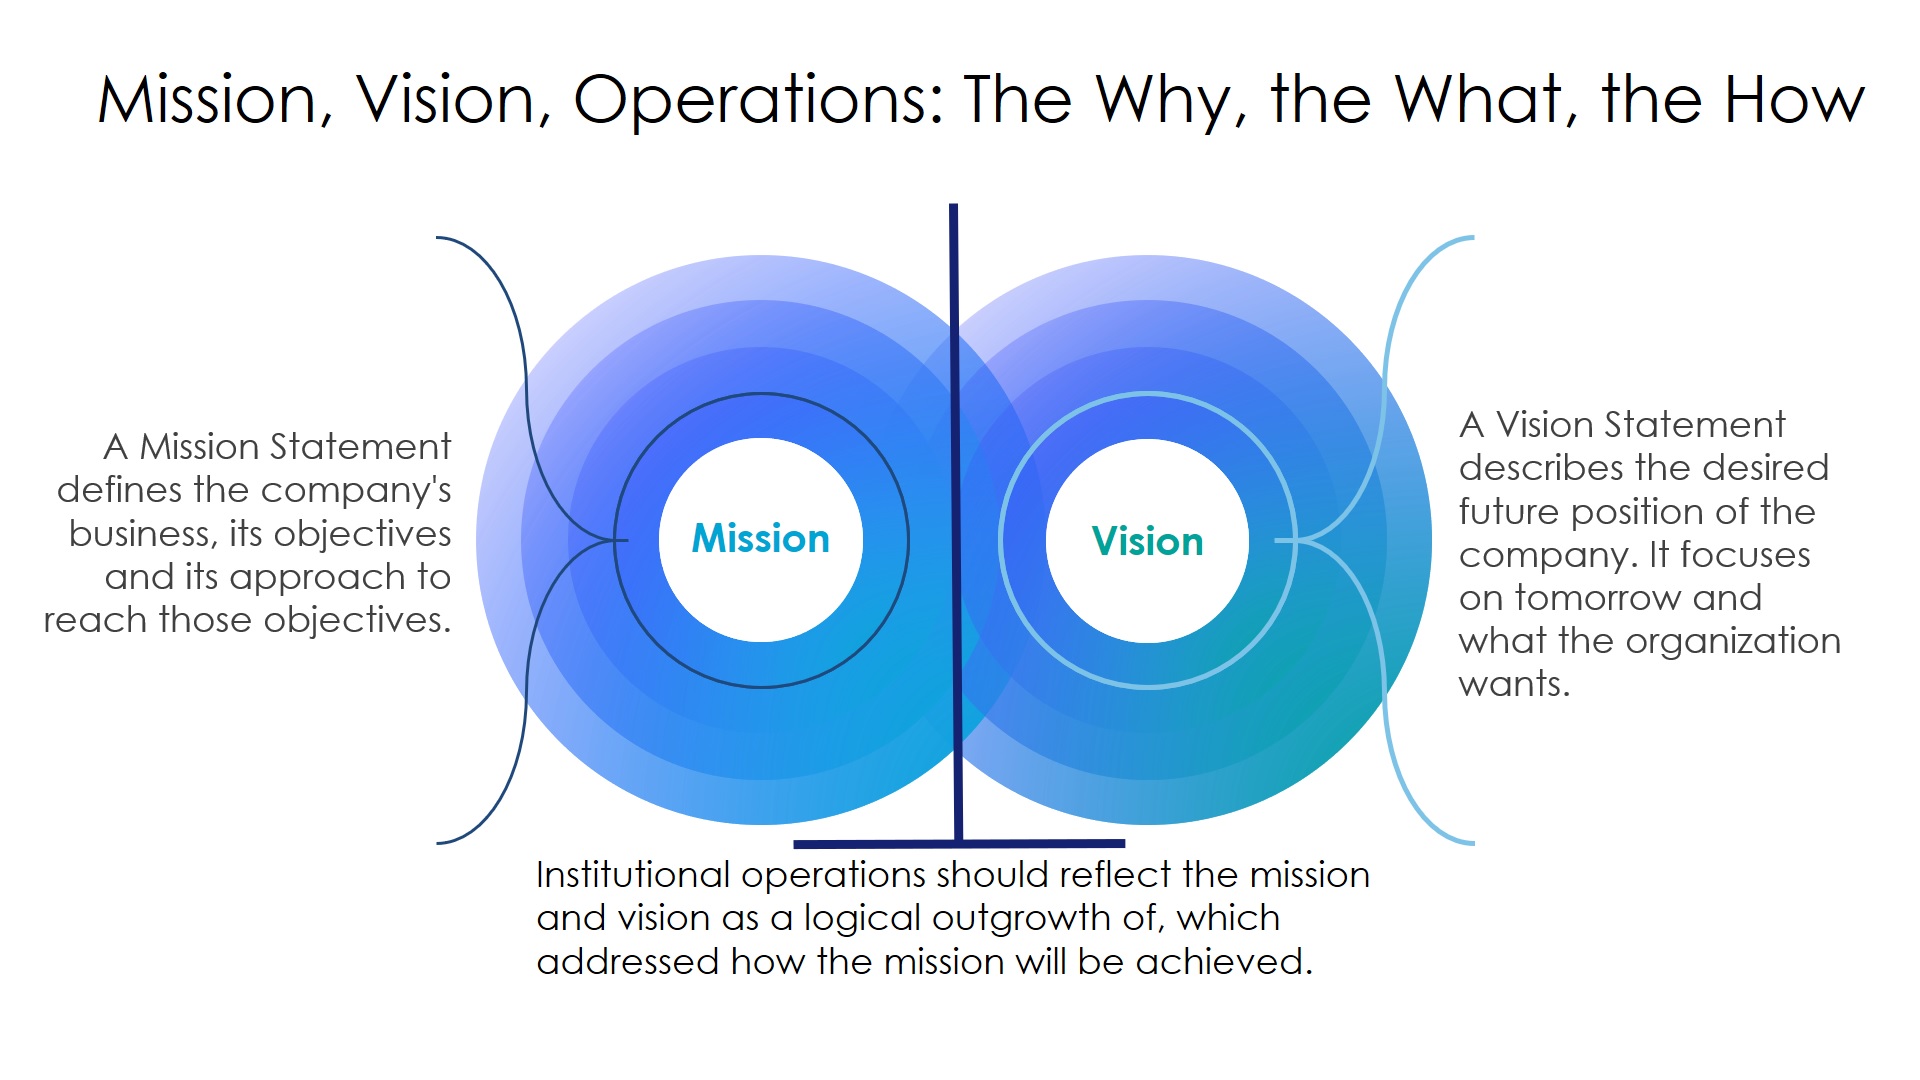
the challenge:
How attached do members of a given institution feel to that institution, and what is the relationship between their perception of the institution’s programs and their feelings of attachment? Are there patterns in detachment/attachment based on various demographic categories, and how might these patterns be explained?
MY ROLE:
Contract Research Associate
Company sponsor:
University of Maryland
abstract
On this project, I served as the primary point of contact for the research design, survey construction, data-collection, data-mining, interpretation, and reporting. The consulting institution wanted to better understand how to increase retention among different institutional affiliates, and what kind of enterprise management strategies could be employed to do so. A concurrent mixed-methods design was used to collect data throughout the institution. Findings revealed a specific set of statistically meaningful challenges in the user flow of various programmatic offerings throughout the institution; quantitative findings were convergent with qualitative narratives. A report of the most meaningful patterns in the data was offered, along with recommendations, a summary of qualitative-quantitative data convergence, and tentative implementation plans.
The Team
In addition to my role as Research Associate, the team was composed of two research assistants who, under my guidance, executed qualitative components of the research process; a business management consultant; a client-representative; and the Director for my department who offered high-level supports where needed.

One of over 40 different analyses that I ran using SPSS (transferred into Excel for easier presentation-related manipulation), which reflect significance in the model for some constructs (a=.01; p=.000) as well as Cohen D-statistics which reflect the relative effect sizes.
PHASE 1:
My team collaborated with the client’s steering committee to ensure that adequate detail was given to the design of the assessment tool. In the design phase, my team conducted a 2-day site visit. We met with the task force and other key stakeholders in order to, more specifically, define the problem and their goals for the assessment instrument we planned to construct.
PHASE 2:
The second phase was the data collection phase in which we made use of my team’s and the client’s marketing channels to promote the survey. We used a census sampling approach in which all affiliates that were actively employed were contacted and invited to participate in the survey. In addition to census sampling we encouraged the client to assist with oversampling for small and underrepresented groups since this was a variable in which they were particularly interested.
We reached our goal of n=1,500 across all 3 affiliate groups. the data were successfully normative and representative.


PHASE 3:

The third phase involved data analysis and report writing in collaboration with the qualitative co-consultants. My approach was to report findings through a combination of descriptive and multivariate statistical techniques using composite variables that were pretested for validity (using metrics such as Chronbach-alpha, Eigen values, skree plots, and simple structure factor analysis).
Preliminary analyses provide confirmation of the psychometric properties of the composite variables included in the study, and provide guidance for data cleaning of random and malicious responding, as well as missing data. Reports were generated for the most statistically significant findings and presented to the client.

Analyses of variances were conducted on the entire sample, inclusive of all affiliates. ANOVA mean’s differences tests were conducted for select dependent variables to examine patterns in the data rather than to test hypotheses. These analyses should not be confused with parametric tests, which employ post positivist hypothesis testing. This particular approach to empiricism is specific to an institutional population rather than the population at large.
Rather than only examining significance levels, I examined effect sizes using F-statistics and Cohen’s d, incorporating only medium sized effects or higher into our discussion of the meaningfulness of the mean differences between groups. This inductive approach to quantitative data analyses provides a wealth of information about the affiliates which is specific to their experience with our client. It also provides some assurance that the person behind the data-point is kept in mind, and that the findings are person-centered.

As a fundamental part of my process, I try to interact with the data rather than just analyze it. The difference, for me, is that one can look for numerical patterns and report findings (I do that too); but to take it a step further, I like to experience the information as if I am the survey participant. I engage the data in such a way that helps me understand the story they are trying to tell me in the numbers.
REPORTING and RECOMMENDATIONS
It is a common practice to make sure to report data in user-friendly language. Not everyone will have the same level of familiarity with data-science. I also make sure to always connect recommendations back to the original challenge and the institutional bottom-line relative to what they hoped to achieve from this consultation. As such, I usually include as much data visualization as possible. I also take this time to run further analyses if needed to fill in gaps in the “story” I’m attempting to tell within the numbers.